In the 2016 election, few spectators realized Donald Trump’s data advantage until after he’d won.
Prior to then, the Democrats in general, Clinton’s campaign in particular, was believed to have the advantage. Barack Obama, in the 2008 and 2012 elections, greatly expanded Democrats data stockpile. Hillary Clinton, drawing from the foundation of Obama’s campaign, not only sought to exploit Democratic data, but to expand it.
Meanwhile, Donald Trump showed little interest in data. Republicans feared that, with him running his campaign, they’d lose the data race (and elections as a result). In reality, though, Trump’s team had a more modern approach to data analysis. Cambridge Analytica, a data analysis group with ties to Trump, were building models based on social media data, developing psychographic profiles of voters in key states, allowing the Trump campaign to microtarget its messages. Democrats based their models on demographics, the traditional approach, which can only proxy a voter’s sentiment, not actually know it. While the Obama campaign had used microtargeting in the past, the end result was switching out one celebrity in an ad to another, not changing the message.
While Trump personally sought to win “bigly,” his campaign was better geared for eking out a narrow win. You could hear some of this strategy in a haunting line he said from the third debate: “Poor Bernie Sanders. He never stood a chance.” This is not a ploy to convince a lot of voters to vote for Trump; it’s a ploy to convince enough Bernie Sanders supporters, bitter from his loss in the primary, to not vote for Clinton.
Messages like this were likely repeated far and wide, but quietly, whispered over social media, and just to those who may be convinced by it. Trump’s campaign rolled out a final big push on social media, microtargeting voters in swing states they could identify as being, in some way, persuadable. Given the right message, they’d either vote for Trump or, perhaps more likely, not vote for either major candidate (either staying home or voting for Gary Johnson/Jill Stein, who gained enough votes in Pennsylvania, Wisconsin, and Michigan to make Clinton President). Trump campaign operatives have said they believe this final push was what won Trump the most efficient Presidential victory (in money and votes) in modern history.
There’s a lot to pick apart from this story, from the undemocratic nature of the Electoral College and the first-past-the-post voting system to the ethical questions raised by microtargeting in election advertising. I will focus on neither of these aspects (at least for now). Instead, I’ll be talking about data set innovation.
As much as some leftists like to claim that the Democrats and the Republicans are just Coke and Pepsi, this is not what the parties believe. They compete intensely, and the divide has only grown over time. Statistical analyses show ever-increasing partisanship not just among the parties but among the populace. This translates to both parties seeking out and deploying any edge they can find, from fundraising to advertising. Naturally, they care greatly about data analytics as well (when I helped the Obama campaign in 2008, all I was doing was collecting data, asking people questions), including so-called “big data.” Data disadvantages can cost elections (or at least mislead the campaign); just ask Mitt Romney, who’s internal models (developed by analysts who were employed, I hear, basically because they were fellow Mormons) had him winning the 2012 election in a landslide.
Thus, political campaigns seek any data advantage they can get, both from existing data sets and new, “unexploited” data sets. We can see a hierarchy emerge in political data:
- Basic voter rolls are fully exploited data sets. They are provided by state governments and available to political campaigns. Utah, for example, sells its voter rolls to any buyer willing to cough up over $1,000, and this data set includes everything from names to the street address to registered political affiliation to participation in past elections.
- Internal campaign polls have potential that’s not yet fully realized, and thus is on the second tier. Publicly, internal campaign data has not been reliable, in the sense that it does not seem to align well with election results, and public polls better predict election results (yes, even the last one). The reason why is unclear, though; it could be because campaigns have (good) reasons to be dishonest about what their internal models say, or because campaigns are (either purposefully or accidentally) misleading themselves. In principle, though, the quality of the data available to campaigns should be better, not worse, than public polls.
- Social media data could fall on the final tier of not being fully exploited. Cambridge Analytica may be the first to fully demonstrate what a microtargeting campaign using social media can do, and it’s likely that microtargeting will only increase in the future. Facebook ads will differ from person to person, along with Google searches. This could profoundly change the shape and nature of elections (for the worse, in my opinion).
These tiers of data sets, though, are not limited to political campaigns. They exist for perhaps every major industry, and the same data sets may be on different tiers for different industries. For example, for-profit schools exploit social media to as full an extent as possible, identifying individuals susceptible to their messages. Meanwhile, social media may be completely unexploited by, say, utility providers. Thus, there can be divisions not only between who does and does not use data, but who uses what data.
It’s in the highly competitive industries where the effect is most noticeable. Economic theory argues that competition breeds innovation. I’m sure many would consider finance and investment a highly competitive field, and as a result, finance pushes the boundaries of technology and data. There’s always a search for an edge. New mathematical models and machine learning algorithms are employed for trading. Traders seek servers near trading floors to trade faster. Data sets are explored and algorithms learn how to use them in new, innovative ways (we know the algorithms are attentive to social media, given the existence of flash crashes). And the search for new data never ends.
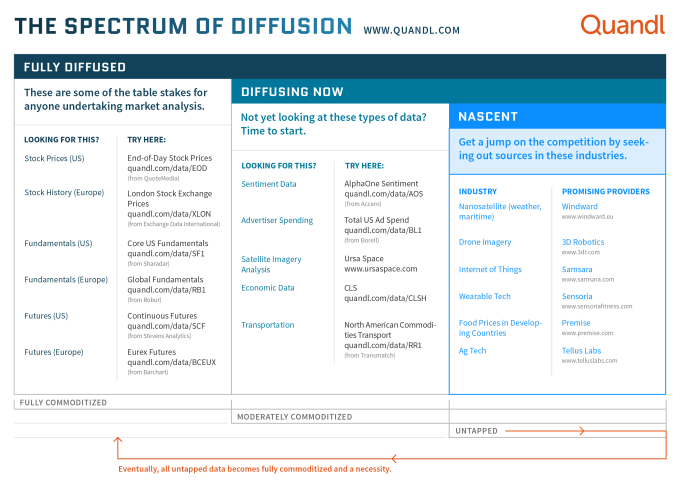
If the evangelists of big data had to distill their message to a single line, it would likely be, “Using lots of data in innovative ways can transform industries.” This is true not just for data in general, but for particular data sets. Some data sets can become a “part of the fabric;” everyone in the field uses them, and those who don’t are quickly filtered out. There are the data sets that have just started being exploited by an industry, and then there are those that are completely new, with untold untapped potential. New companies can be founded based off these innovative data sets. Part of the adventure of data analysis is finding and exploiting them.
Ignoring them, though, can be costly. Just ask the Clinton campaign.
This post was inspired by Raquel Sapnu. He works with Quandl, a company that provides financial and economic data for investors. He provided me with a graphic illustrating the cycle of “data set diffusion,” along with some data sets at different levels of diffusion. Thank you for sharing, Raquel!