CPAT and the Rényi-Type Statistic; End-of-Sample Change Point Detection in R

This article is also available in PDF form.


Introduction

I started my first research project as a graduate student when I was only in the MSTAT program at the University of Utah, at the very end of 2015 (or very beginning of 2016; not sure exactly when) with my current advisor, Lajos Horváth. While I am disappointed it took this long, I am glad to say that the project is finished and I am finally published.

Continue reading

Problems in Estimating GARCH Parameters in R (Part 2; rugarch)

Introduction

Now here is a blog post that has been sitting on the shelf far longer than it should have. Over a year ago I wrote an article about problems I was having when estimating the parameters of a GARCH(1,1) model in R. I documented the behavior of parameter estimates (with a focus on \beta) and perceived pathological behavior when those estimates are computed using fGarch. I called for help from the R community, including sending out the blog post over the R Finance mailing list.

Continue reading

The Distribution of Time Between Recessions: Revisited (with MCHT)

Introduction

These past few weeks I’ve been writing about a new package I created, MCHT. Those blog posts were basically tutorials demonstrating how to use the package. (Read the first in the series here.) I’m done for now explaining the technical details of the package. Now I’m going to use the package for purpose I initially had: exploring the distribution of time separating U.S. economic recessions.

Continue reading

Stock Data Analysis with Python (Second Edition)

Introduction

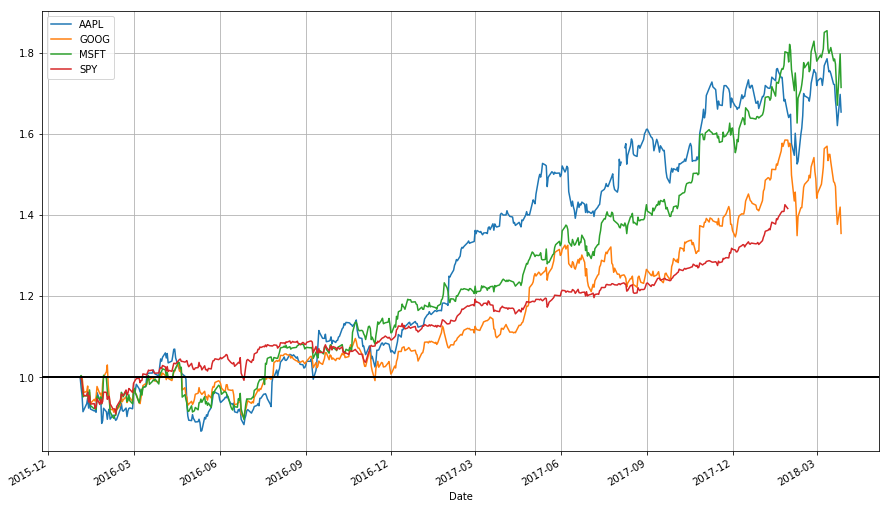
This is a lecture for MATH 4100/CS 5160: Introduction to Data Science, offered at the University of Utah, introducing time series data analysis applied to finance. This is also an update to my earlier blog posts on the same topic (this one combining them together). I strongly advise referring to this blog post instead of the previous ones (which I am not altering for the sake of preserving a record). The code should work as of July 7th, 2018. (And sorry for some of the formatting; WordPress.com’s free version doesn’t play nice with code or tables.)

Continue reading

A Recession Before 2020 Is Likely; On the Distribution of Time Between Recessions

I recently saw a Reddit thread in r/PoliticalDiscussion asking the question “If the economy is still booming 2020, how should the Democratic address this?” This gets to an issue that’s been on my mind since at least 2016, maybe even 2014: when will the current period of economic growth end?

Continue reading

Problems In Estimating GARCH Parameters in R

UPDATE (11/2/17 3:00 PM MDT): I got the following e-mail from Brian Peterson, a well-known R finance contributor, over R’s finance mailing list:

I would strongly suggest looking at rugarch or rmgarch. The primary
maintainer of the RMetrics suite of packages, Diethelm Wuertz, was
killed in a car crash in 2016. That code is basically unmaintained.

I will see if this solves the problem. Thanks Brian! I’m leaving this post up though as a warning to others to avoid fGarch in the future. This was news to me, books often refer to fGarch, so this could be a resource for those looking for working with GARCH models in R why not to use fGarch.

UPDATE (11/2/17 11:30 PM MDT): I tried a quick experiment with rugarch and it appears to be plagued by this problem as well. Below is some quick code I ran. I may post a full study as soon as tomorrow.

library(rugarch)

spec = ugarchspec(variance.model = list(garchOrder = c(1, 1)), mean.model = list(armaOrder = c(0, 0), include.mean = FALSE), fixed.pars = list(alpha1 = 0.2, beta1 = 0.2, omega = 0.2))
ugarchpath(spec = spec, n.sim = 1000, n.start = 1000) -> x
srs = x@path$seriesSim
spec1 = ugarchspec(variance.model = list(garchOrder = c(1, 1)), mean.model = list(armaOrder = c(0, 0), include.mean = FALSE))
ugarchfit(spec = spec1, data = srs)
ugarchfit(spec = spec1, data = srs[1:100])

These days my research focuses on change point detection methods. These are statistical tests and procedures to detect a structural change in a sequence of data. An early example, from quality control, is detecting whether a machine became uncalibrated when producing a widget. There may be some measurement of interest, such as the diameter of a ball bearing, that we observe. The machine produces these widgets in sequence. Under the null hypothesis, the ball bearing’s mean diameter does not change, while under the alternative, at some unkown point in the manufacturing process the machine became uncalibrated and the mean diameter of the ball bearings changed. The test then decides between these two hypotheses.

Continue reading

Getting S&P 500 Stock Data from Quandl/Google with Python

DISCLAIMER: Any losses incurred based on the content of this post are the responsibility of the trader, not me. I, the author, neither take responsibility for the conduct of others nor offer any guarantees. None of this should be considered as financial advice; the content of this article is only for educational/entertainment purposes.

A few months ago I wrote a blog post about getting stock data from either Quandl or Google using R, and provided a command line R script to automate the task. In this post I repeat the task but with Python. If you’re interested in the motivation and logic of the procedure, I suggest reading the post on the R version. The Python version works similarly.

Continue reading

Let’s Create Our Own Cryptocurrency

Today I’m sharing my favorite blog post of the week, written by a blogger with username cranklin.

Have whatever opinion you want about crypto-currencies, Bitcoin, and so on, but many in the business world take blockchain technology very seriously. (I read about it regularly in The Economist, and a new book by David Birch entitled Before Bablyon, Beyond Bitcoin, imagines a new crypto-currency world order with money entering a new evolutionary state, with everything from governments to community churches issuing their own coins; the book is on my reading list.) Perhaps the best (and most-fun) way to lean about the technology is to create your own crypto-currency. Then share it with your friends and family because why not.

Perhaps at some point in the future I will create my own coin and write about it as well. If I do, I will be using this post as a reference.

cranklin.com

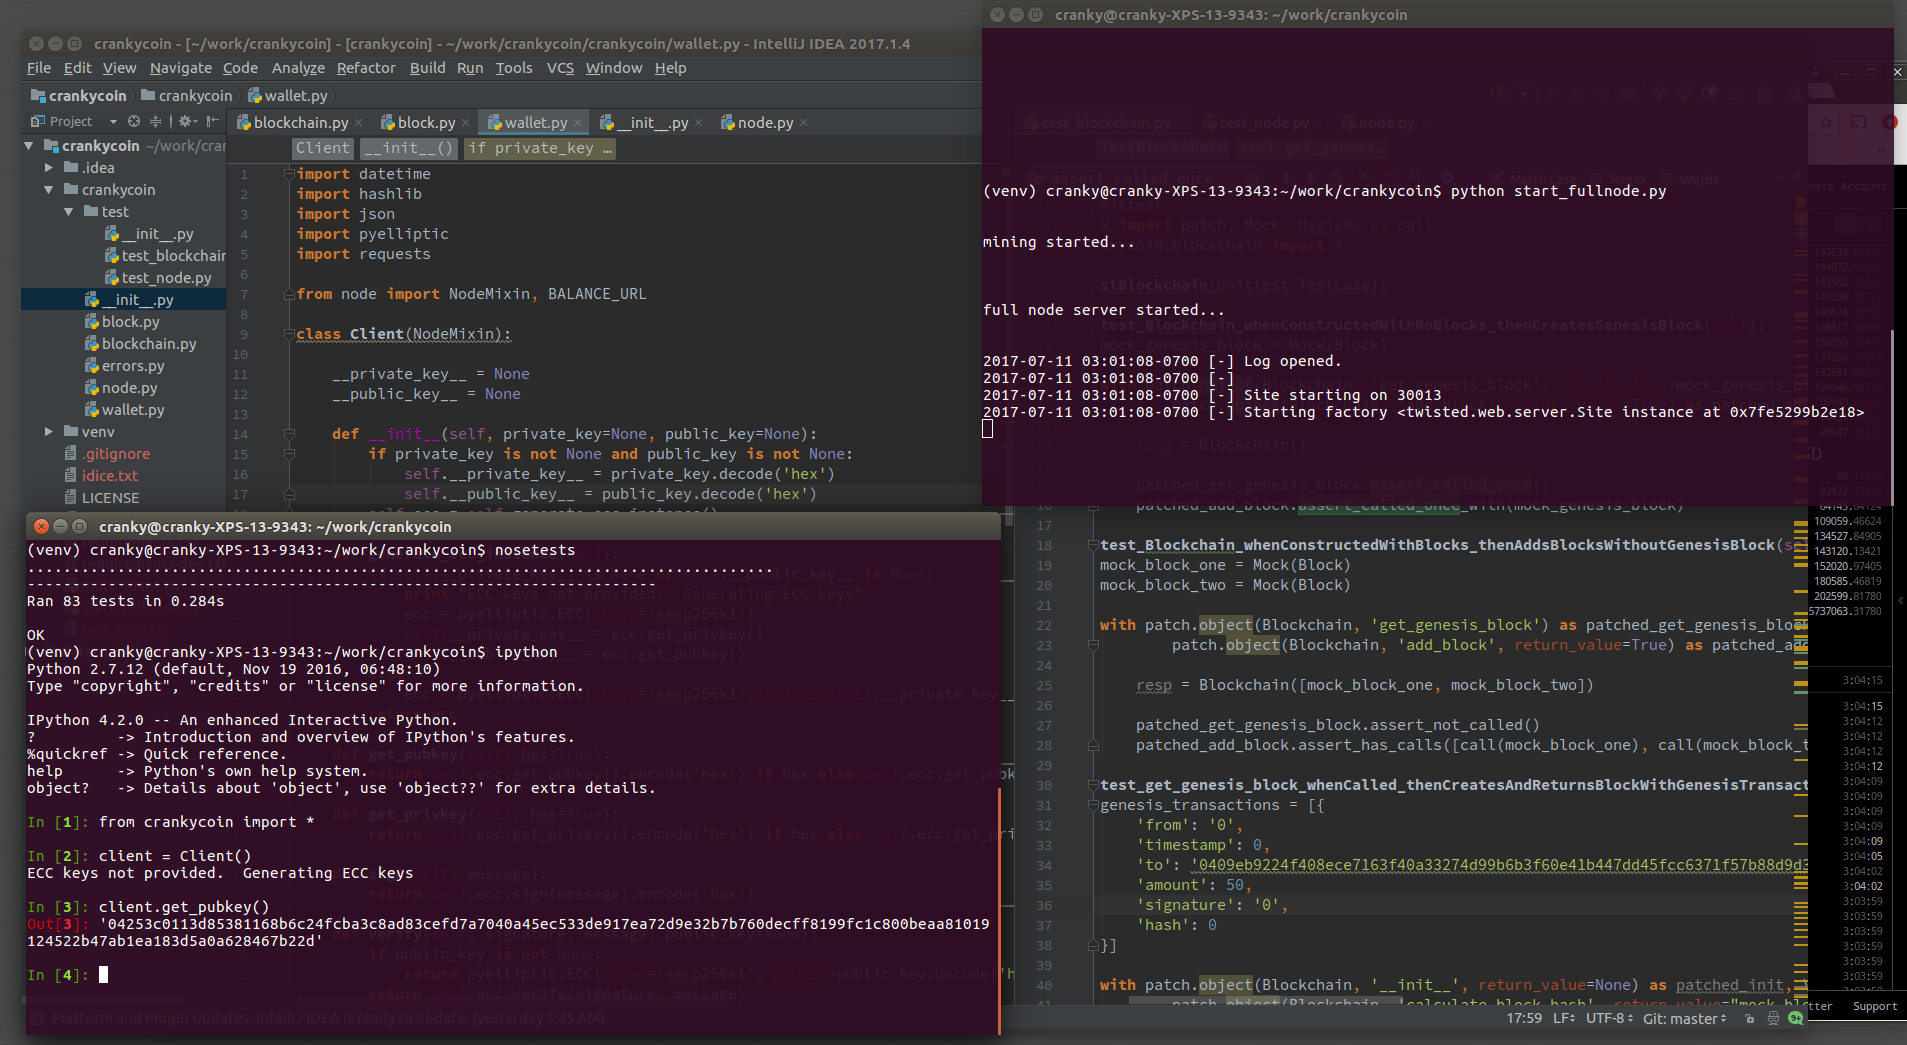
I’ve been itching to build my own cryptocurrency… and I shall give it an unoriginal & narcissistic name: Cranky Coin.

After giving it a lot of thought, I decided to use Python. GIL thread concurrency is sufficient. Mining might suffer, but can be replaced with a C mining module. Most importantly, code will be easier to read for open source contributors and will be heavily unit tested. Using frozen pip dependencies, virtualenv, and vagrant or docker, we can fire this up fairly easily under any operating system.

I decided to make Cranky coin a VERY simple, but complete cryptocurrency/blockchain/wallet system. This implementation will not include smart contracts, transaction rewards, nor utilize Merkel trees. Its only purpose is to act as a decentralized ledger. It is rudimentary, but I will eventually fork a few experimental blockchains with advanced features from this one.

The Wallet
This currency will only be compatible with…

View original post 1,688 more words

Downloading S&P 500 Stock Data from Google/Quandl with R (Command Line Script)

DISCLAIMER: Any losses incurred based on the content of this post are the responsibility of the trader, not me. I, the author, neither take responsibility for the conduct of others nor offer any guarantees. None of this should be considered as financial advice; the content of this article is only for educational/entertainment purposes.

While most Americans have heard of the Dow Jones Industrial Average (DJIA), most people active in finance consider the S&P 500 stock index to be the better barometer of the overall American stock market. The 500 stocks included in the index are large-cap stocks seen as a leading indicator for the performance of stocks overall. Thus the S&P 500 and its component stocks are sometimes treated as “the market.”

Continue reading

Stock Trading Analytics and Optimization in Python with PyFolio, R’s PerformanceAnalytics, and backtrader

DISCLAIMER: Any losses incurred based on the content of this post are the responsibility of the trader, not me. I, the author, neither take responsibility for the conduct of others nor offer any guarantees. None of this should be considered as financial advice; the content of this article is only for educational/entertainment purposes.

Introduction

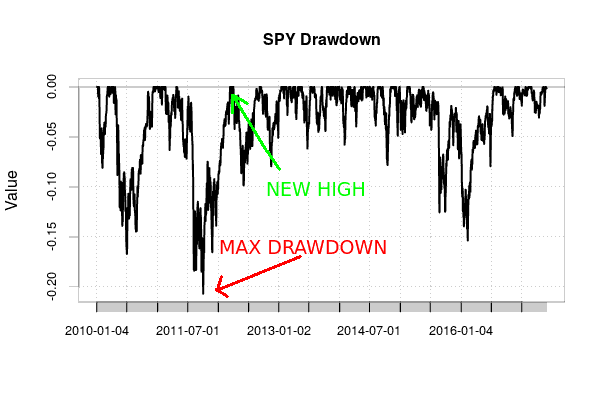
Having figured out how to perform walk-forward analysis in Python with backtrader, I want to have a look at evaluating a strategy’s performance. So far, I have cared about only one metric: the final value of the account at the end of a backtest relative. This should not be the only metric considered. Most people care not only about how much money was made but how much risk was taken on. People are risk-averse; one of finance’s leading principles is that higher risk should be compensated by higher returns. Thus many metrics exist that adjust returns for how much risk was taken on. Perhaps when optimizing only with respect to the final return of the strategy we end up choosing highly volatile strategies that lead to huge losses in out-of-sample data. Adjusting for risk may lead to better strategies being chosen.

Continue reading