Packt Publishing has turned another one of my video courses, Training Your Systems with Python Statistical Modeling, into a book! This book is now available for purchase.
Packt Publishing has turned another one of my video courses, Training Your Systems with Python Statistical Modeling, into a book! This book is now available for purchase.

Dave’s Donuts offers 14 flavors of donuts (consider the supply of each flavor as being unlimited). The “grab bag” box consists of flavors randomly selected to be in the box, each flavor equally likely for each one of the dozen donuts. What is the probability that at most three flavors are in the grab bag box of a dozen?

I announced months ago that one of my video courses, Unpacking NumPy and Pandas, was going to be turned into a book. Today I’m pleased to announce that this book is available!

I’m pleased to announce my fourth and final video course. The course has already been out for a couple months by now, but that doesn’t mean it’s too late for me to write about it!

Last fall my adviser alerted me to the MSRI workshop on high-dimensional data and suggested I may be interested. I applied and was accepted to participate. Thus, from July 9th to July 20th I stayed in San Francisco (for the first time in my life), living in the dorms of UC Berkeley and attending the workshop. I got to experience San Francisco’s legendary weather (escaping Salt Lake City’s triple-digit heat) while learning mathematics. I enjoyed the experience and wanted to share it.
I have heard from my publisher, Packt Publishing, that my video course Unpacking NumPy and Pandas will become a book!
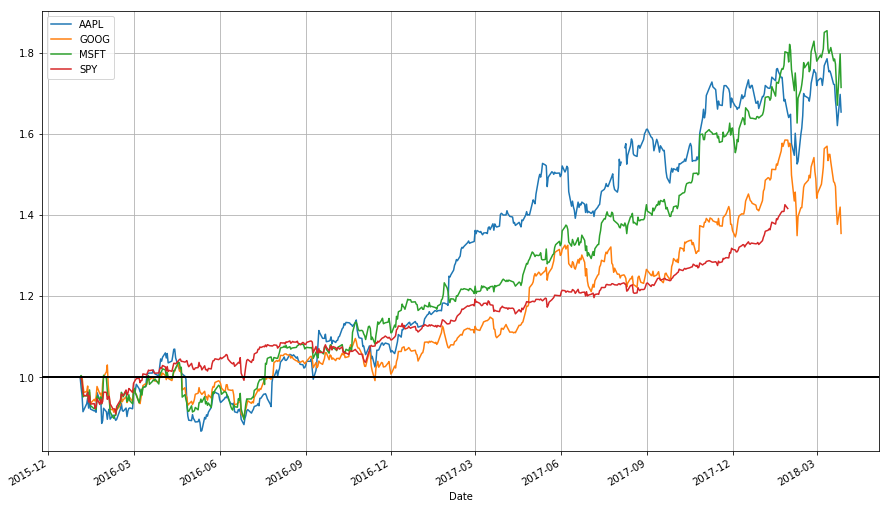
This is a lecture for MATH 4100/CS 5160: Introduction to Data Science, offered at the University of Utah, introducing time series data analysis applied to finance. This is also an update to my earlier blog posts on the same topic (this one combining them together). I strongly advise referring to this blog post instead of the previous ones (which I am not altering for the sake of preserving a record). The code should work as of July 7th, 2018. (And sorry for some of the formatting; WordPress.com’s free version doesn’t play nice with code or tables.)

This post is actually months late, but like with my last video course announcement, it’s better late than never. And besides, of my video courses, I had the most fun writing this one.

This news is a few weeks late, but better late than never!
DISCLAIMER: Any losses incurred based on the content of this post are the responsibility of the trader, not me. I, the author, neither take responsibility for the conduct of others nor offer any guarantees. None of this should be considered as financial advice; the content of this article is only for educational/entertainment purposes.
A few months ago I wrote a blog post about getting stock data from either Quandl or Google using R, and provided a command line R script to automate the task. In this post I repeat the task but with Python. If you’re interested in the motivation and logic of the procedure, I suggest reading the post on the R version. The Python version works similarly.
