Around September of 2016 I wrote two articles on using Python for accessing, visualizing, and evaluating trading strategies (see part 1 and part 2). These have been my most popular posts, up until I published my article on learning programming languages (featuring my dad’s story as a programmer), and has been translated into both Russian (which used to be on backtest.ru at a link that now appears to no longer work) and Chinese (here and here). R has excellent packages for analyzing stock data, so I feel there should be a “translation” of the post for using R for stock data analysis.
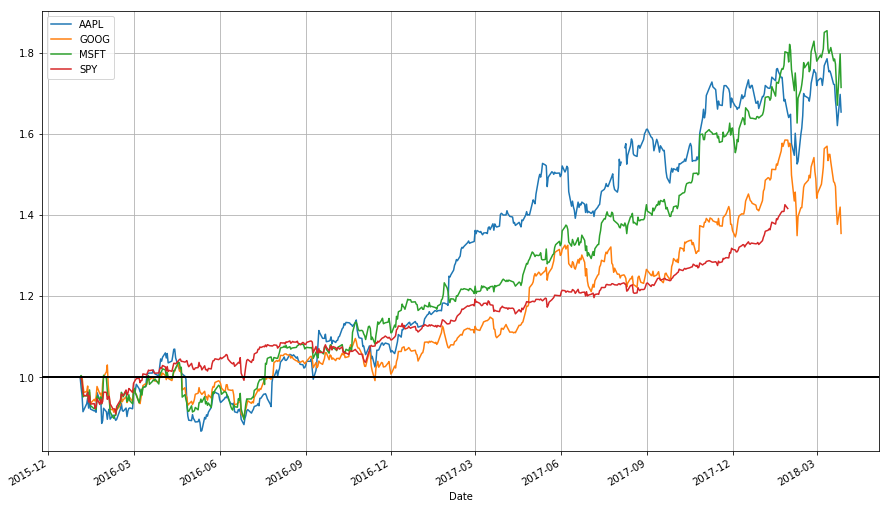
This post is the second in a two-part series on stock data analysis using R, based on a lecture I gave on the subject for MATH 3900 (Data Science) at the University of Utah. (You can read the first post here.) In these posts, I discuss basics such as obtaining the data from Yahoo! Finance using pandas, visualizing stock data, moving averages, developing a moving-average crossover strategy, backtesting, and benchmarking. The final post will include practice problems. This post discusses moving average crossover strategies,backtesting, and benchmarking.
NOTE: The information in this post is of a general nature containing information and opinions from the author’s perspective. None of the content of this post should be considered financial advice. Furthermore, any code written here is provided without any form of guarantee. Individuals who choose to use it do so at their own risk.
Continue reading →