Stock Data Analysis with Python (Second Edition)

Introduction

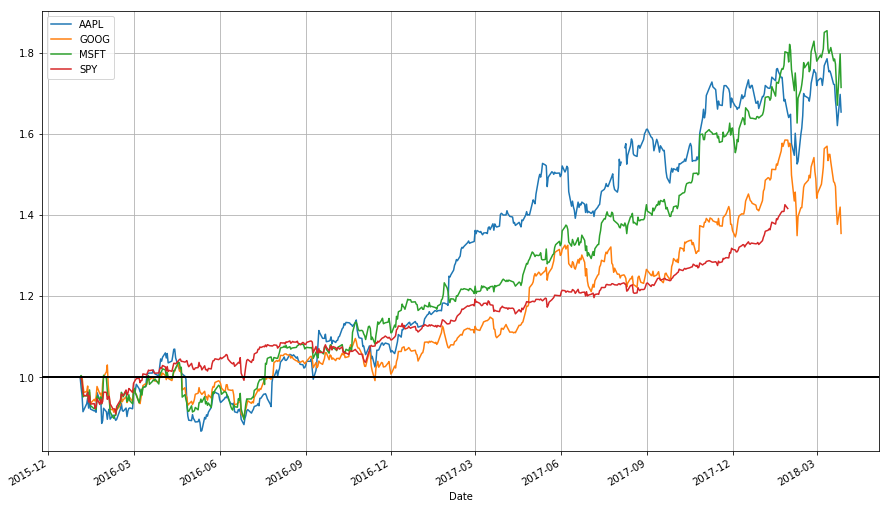
This is a lecture for MATH 4100/CS 5160: Introduction to Data Science, offered at the University of Utah, introducing time series data analysis applied to finance. This is also an update to my earlier blog posts on the same topic (this one combining them together). I strongly advise referring to this blog post instead of the previous ones (which I am not altering for the sake of preserving a record). The code should work as of July 7th, 2018. (And sorry for some of the formatting; WordPress.com’s free version doesn’t play nice with code or tables.)
Continue reading

Getting S&P 500 Stock Data from Quandl/Google with Python

DISCLAIMER: Any losses incurred based on the content of this post are the responsibility of the trader, not me. I, the author, neither take responsibility for the conduct of others nor offer any guarantees. None of this should be considered as financial advice; the content of this article is only for educational/entertainment purposes.

A few months ago I wrote a blog post about getting stock data from either Quandl or Google using R, and provided a command line R script to automate the task. In this post I repeat the task but with Python. If you’re interested in the motivation and logic of the procedure, I suggest reading the post on the R version. The Python version works similarly.

Continue reading

Downloading S&P 500 Stock Data from Google/Quandl with R (Command Line Script)

DISCLAIMER: Any losses incurred based on the content of this post are the responsibility of the trader, not me. I, the author, neither take responsibility for the conduct of others nor offer any guarantees. None of this should be considered as financial advice; the content of this article is only for educational/entertainment purposes.

While most Americans have heard of the Dow Jones Industrial Average (DJIA), most people active in finance consider the S&P 500 stock index to be the better barometer of the overall American stock market. The 500 stocks included in the index are large-cap stocks seen as a leading indicator for the performance of stocks overall. Thus the S&P 500 and its component stocks are sometimes treated as “the market.”

Continue reading

Stock Trading Analytics and Optimization in Python with PyFolio, R’s PerformanceAnalytics, and backtrader

DISCLAIMER: Any losses incurred based on the content of this post are the responsibility of the trader, not me. I, the author, neither take responsibility for the conduct of others nor offer any guarantees. None of this should be considered as financial advice; the content of this article is only for educational/entertainment purposes.

Introduction

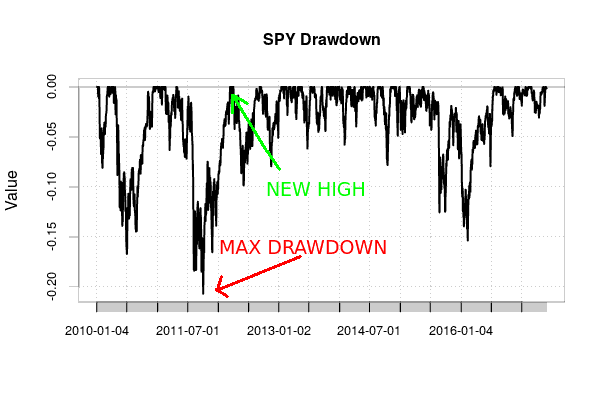
Having figured out how to perform walk-forward analysis in Python with backtrader, I want to have a look at evaluating a strategy’s performance. So far, I have cared about only one metric: the final value of the account at the end of a backtest relative. This should not be the only metric considered. Most people care not only about how much money was made but how much risk was taken on. People are risk-averse; one of finance’s leading principles is that higher risk should be compensated by higher returns. Thus many metrics exist that adjust returns for how much risk was taken on. Perhaps when optimizing only with respect to the final return of the strategy we end up choosing highly volatile strategies that lead to huge losses in out-of-sample data. Adjusting for risk may lead to better strategies being chosen.

Continue reading

Walk-Forward Analysis Demonstration with backtrader

DISCLAIMER: Any losses incurred based on the content of this post are the responsibility of the trader, not me. I, the author, neither take responsibility for the conduct of others nor offer any guarantees. None of this should be considered as financial advice; the content of this article is only for educational/entertainment purposes.

Finally I can apply a walk-forward analysis!

Continue reading

An Introduction to Stock Market Data Analysis with R (Part 1)

Around September of 2016 I wrote two articles on using Python for accessing, visualizing, and evaluating trading strategies (see part 1 and part 2). These have been my most popular posts, up until I published my article on learning programming languages (featuring my dad’s story as a programmer), and has been translated into both Russian (which used to be on backtest.ru at a link that now appears to no longer work) and Chinese (here and here). R has excellent packages for analyzing stock data, so I feel there should be a “translation” of the post for using R for stock data analysis.

Continue reading

An Introduction to Stock Market Data Analysis with Python (Part 1)

THIS POST IS OUT OF DATE: AN UPDATE OF THIS POST’S INFORMATION IS AT THIS LINK HERE! (Also I bet that WordPress.com just garbled the code in this post.)

I’m keeping this post up for the sake of preserving a record.

This post is the first in a two-part series on stock data analysis using Python, based on a lecture I gave on the subject for MATH 3900 (Data Science) at the University of Utah. In these posts, I will discuss basics such as obtaining the data from Yahoo! Finance using pandas, visualizing stock data, moving averages, developing a moving-average crossover strategy, backtesting, and benchmarking. The final post will include practice problems. This first post discusses topics up to introducing moving averages.

NOTE: The information in this post is of a general nature containing information and opinions from the author’s perspective. None of the content of this post should be considered financial advice. Furthermore, any code written here is provided without any form of guarantee. Individuals who choose to use it do so at their own risk.

Continue reading