
Introduction
I spent good chunks of Friday, Saturday, and Sunday attempting to write another blog post on using R and the quantstrat package for backtesting, and all I have to show for my work is frustration. So I’ve started to fall out of love with quantstrat and am thinking of exploring Python backtesting libraries from now on.
Here’s my story…
Cross-Validation
Let’s suppose you’ve read my past blog posts on using R for analyzing stock data, in particular the most recent blog post on R for finance, on parameter optimization and order types. You’ll notice that we’ve been doing two things (perhaps among others):
- We only used most recent data as out-of-sample data. What if there are peculiarities unique to the most-recent time frame, and it’s not a good judge (alone) of future performance?
- We evaluate a strategy purely on its returns. Is this the best approach? What if a strategy doesn’t earn as much as another but it handles risk well?
I wanted to write an article focusing on addressing these points, by looking at cross-validation and different metrics for evaluating performance.
Data scientists want to fit training models to data that will do a good job of predicting future, out-of-sample data points. This is not done by finding the model that performs the best on the training data. This is called overfitting; a model may appear to perform well on training data but will not generalize to out-of-sample data. Techniques need to be applied to prevent against it.
A data scientist may first split her data set used for developing a predictive algorithm into a training set and a test set. The data scientist locks away the test set in a separate folder on the hard drive, never looking at it until she’s satisfied with the model she’s developed using the training data. The test set will be used once a final model has been found to determine the final model’s expected performance.
She would like to be able to simulate out-of-sample performance with the training set, though. The usual approach to do this is split the training set into, say, 10 different folds, or smaller data sets, so she can apply cross-validation. With cross-validation, she will choose one of the folds to be held out, and she fits a predictive model on the remaining nine folds. After fitting the model, she sees how the fitted model performs on the held-out fold, which the fitted model has not seen. She then repeats this model for the nine other folds, to get a sense of the distribution of the performance of the model, or average performance, on out-of-sample data. If there are hyperparameters (which are parameters that describe some higher-order aspect of a model and not learned from the data in the usual way other prarameters are; they’re difficult to define rigorously), she may try different combinations of them and see which combination lead to the model with the best predictive ability in cross-validation. After determining which predictive model generally leads to the best results and which hyperparameters lead to optimal results, she trains a model on the training set with those hyperparameters, evaluates its performance on the test set, and reports the results, perhaps deploying the model.
For those developing trading algorithms, the goals are similar, but there are some key differences:
- We evaluate a trading method not by predictive accuracy but by some other measure of performance, such as profitability or profitability relative to risk. (Maybe predictive accuracy is profitable, maybe not; if the most profitable trading system always underestimates its profitability, we’re fine with it.)
- We are using data where time and the order in which data comes in is thought to matter. We cannot just reshuffle data; important features would be lost. So we cannot divide up the data set randomly into different folds; order must be preserved.
I’ll talk more about how we could evaluate a trading system later; for now, let’s focus on how we can apply the idea of cross-validation analysis.
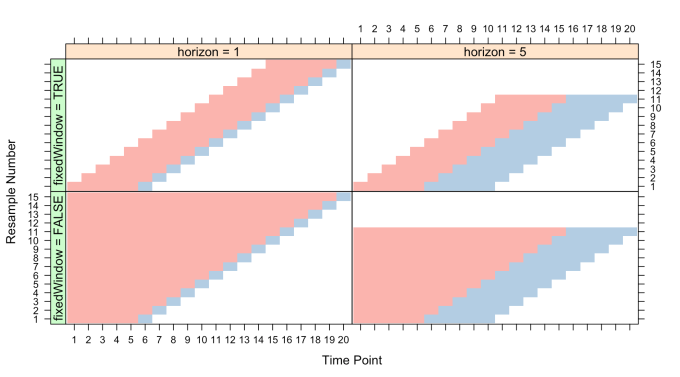
(Illustration by Max Kuhn in his book, The caret Package.)
For time-dependent data, we can employ walk-forward analysis or rolling forecast origin techniques. This comes in various flavors (see the above illustration), but I will focus on one flavor. We first divide up the data set into, say, ten periods. We first fit a trading algorithm on the first period in the data set, then see how it performs on the “out-of-sample” second period. Then we repeat for the second and third periods, third and fourth periods, and so on until we’ve run to the end of the data set. The out-of-sample data sets are then used for evaluating the potential performance of the trading system in question. If we like, we may be keeping a final data set, perhaps the most recent data set, for final evaluation of whatever trading system passes this initial test.
Other variants include overlapping training/testing periods (as described, my walk-forward analysis approach does not overlap) or ones where the initial window grows from beginning to end. Of these, I initially think either the approach I’ve described or the approach with overlapping training/testing periods makes most sense.
Attempting to Use quantstrat
I discovered that quantstrat has a function that I thought would implement the type of walk-forward analysis I wanted, called walk.forward(). I was able to define a training period duration, a testing period duration, an objective function to maximize, and many other features I wanted. It could take a strategy designed for optimization with apply.paramset() and apply a walk-forward analysis.
So I tried it once and the results were cryptic. The function returns a list with the results of training… but no sign of the test results. I would try looking at the portfolio object and tradeStats() output, but there was no sign of a portfolio. I had no idea why. I still have no idea where the portfolio went initially. I would try clearing my environments and restarting R and doing the whole process again. Same results: no sign of a portfolio, and all I got was a list of results for training data, with no sign of results for testing data. I looked at the source code. I saw that it was doing something with the test data: it was using applyStrategy() on the test data.
I had no idea what the hell that meant. When I use applyStrategy() as the user, I have to assume that the portfolio is wiped out, the account is reset, and every application is effectively a fresh start. So when I saw that line, it looked as if the function got an optimized function, applied it to the test data, and would repeat this process all the while forgetting the results of previous applications of the optimized strategy to test data sets. But online sources said that was not what was happening; the results of this backtesting were being appended back-to-back, which did not mesh with either my notion of walk-forward analysis (which allows for overlapping time frames, which does not mean you can “glue” together test data results) or what applyStrategy() does. And it still does not make sense to me. (That is what it does, though.)
The fact that the demonstration of walk.forward() supplied with quantstrat is bugged (and I never found how to fix all its bugs) didn’t help.
So I tried using the function’s auditing feature; by supplying a string to audit.prefix, *.RData files will be created containing the results of training and testing, storing them in a special .audit environment. So I changed the working directory to one specifically meant for the audit files (there could be a lot of them and I didn’t want to clutter up my other directories; I hate clutter), passed a string to audit.prefix, and tried again. After the analysis was completed, I look in the directory to see the files.
There’s nothing there.
It took hours and I had to go through a debugger to finally discover that walk.forward() was saving files, but it was using my Documents directory as the working directory, not the directory I setwd()ed into. Why? I have no idea. It could be quantstrat, blotter, or RStudio’s workbooks. I have no idea how long it took to figure out where my files had gone, but it was too long however long it was.
Good news though was that I now could try and figure out what was happening to the test data. This presentation by Guy Yollin was helpful, though it still took a while to get it figured out.
From what I can tell, what walk.forward() does is simulate a trading strategy that optimizes, trades, and re-optimizes on new data, and trades. So it doesn’t look like cross-validation as I described but rather a trading strategy, and that’s not really what I wanted here. I wanted to get a sense of the distribution of returns when using window sizes chosen optimally from backtesting. I don’t think there’s any simple way to do that with quantstrat.
Furthermore, I can’t see how I can collect the kind of statistics I want, such as a plot of the value of the account or the account’s growth since day one, with the way the walk-forward analysis is being done. Furthermore, the results I did get look… strange. I don’t know how those kinds of results would appear… at all. They look like nonsense. So I don’t even know if the function is working right.
Oh, did I mention that I discovered that the way I thought backtesting was being done isn’t how it’s actually done in quantstrat? When I was doing backtesting, I would rather see the results of the backtest on a variety of stocks instead of just one. I imagine an automated backtest behaving like a trader with an account, and active trades tie up the trader’s funds. So if the trader sees an opportunity but does not have the cash to act on it, the trader does not take the trade. (There is no margin here.)
I thought applyStrategy() was emulating such a trader, but the documentation (and the logs produced, for that matter), suggest that’s not what’s happening. It backtests on each symbol separately, unaware of any other positions that may exist. I don’t like that.
It was very difficult to figure this all out, especially given the state of the documentation currently. That said, in the developers’ defense, quantstrat is still considered under heavy development. Maybe in the future the documentation will be better. I feel, though, that creating good documentation is not something done once you’ve completed coding; you write good documentation as you code, not after.
blotter: The Fatal Flaw
Granted, I’m an ignorant person, but I don’t feel like all the confusion that lead to me wasting my weekend is completely my fault. quantstrat‘s design is strange and, honestly, not that intuitive. I think the problem stems from quantstrat‘s building off an older, key package: blotter.
blotter is a package intended to manage transactions, accounts, portfolios, financial instruments, and so on. All the functions for creating accounts and portfolios are blotter functions, not quantstrat functions. blotter does this by setting up its own environment, the .blotter environment, and the functions I’ve shown are for communicating with this environment, adding and working with entities stored in it.
I don’t know what the purpose of creating a separate environment for managing those objects is. I feel that by doing so a wall has been placed between me and the objects I’m trying to understand. quantstrat takes this further by defining a .strategy environment where strategies actually “live”, so we must use special functions to interact with that separate universe, adding features to our strategies, deleting and redefining them with special functions, and so on.
To me, this usage of environments feels very strange, and I think it makes quantstrat difficult and unintuitive. In some sense, I feel like strategies, portfolios, accounts, etc. are pseudo-objects in the object oriented programming (OOP) sense, and the developers of blotter and quantstrat are trying to program like R is a language that primarily follows the OOP paradigm.
While R does support OOP, it’s a very different kind of OOP and I would not call R an OOP language. R is a functional programming language. Many see the tidyverse as almost revolutionary in making R easy to use. That’s because the tidyverse of package, including ggplot2, magrittr, dplyr, and others, recognize that R relies on the functional programming paradigm and this paradigm does, in fact, lead to elegant code. Users can write pipelines and functions to put into pipelines that make complicated tasks easy to program. No part of the pipeline is cut off from the user, and the process of building the pipeline is very intuitive.
When I wrote my first blog post on R for finance and trading, one of the common comments I heard was, “tidyquant is better.” I have yet to look seriously at tidyquant, and maybe it is better, but so far all I’ve seen is tidyquant replace quantmod‘s functionality, and I have no complaint with quantmod (although tidyquant may also be suffering from the original sin of relying too heavily on environments). That said, the tidyquant approach may yet be the future of R backtesting.
Let’s try re-imagining what a better R backtesting package might look like, one that takes lessons from the tidyverse. Let’s first look at defining a strategy with quantstrat (after all the obnoxious boilerplate code).
portfolio_st <- "myStrat"

rm.strat(strategy_st)  # Must be done to delete or define a new strategy
strategy(strategy_st, store = TRUE)  # This is how to create a strategy

add.indicator(strategy = strategy_st, name = "SMA",
              arguments = list(x = quote(Cl(mktdata)),
                               n = 20),
              label = "fastMA")
add.indicator(strategy = strategy_st, name = "SMA",
              arguments = list(x = quote(Cl(mktdata)),
                               n = 50),
              label = "slowMA")

add.signal(strategy = strategy_st, name = "sigCrossover2",  # Remember me?
           arguments = list(columns = c("fastMA", "slowMA"),
                            relationship = "gt"),
           label = "bull")
add.signal(strategy = strategy_st, name = "sigCrossover2",
           arguments = list(columns = c("fastMA", "slowMA"),
                            relationship = "lt"),
           label = "bear")
add.rule(strategy = strategy_st, name = "ruleSignal",
         arguments = list(sigcol = "bull",
                          sigval = TRUE,
                          ordertype = "market",
                          orderside = "long",
                          replace = FALSE,
                          TxnFees = "fee",
                          prefer = "Open",
                          osFUN = osMaxDollarBatch,
                          maxSize = quote(floor(getEndEq(account_st,
                                                   Date = timestamp) * .1)),
                          tradeSize = quote(floor(getEndEq(account_st,
                                                   Date = timestamp) * .1)),
                          batchSize = 100),
         type = "enter", path.dep = TRUE, label = "buy")
add.rule(strategy = strategy_st, name = "ruleSignal",
         arguments = list(sigcol = "bear",
                          sigval = TRUE,
                          orderqty = "all",
                          ordertype = "market",
                          orderside = "long",
                          replace = FALSE,
                          TxnFees = "fee",
                          prefer = "Open"),
         type = "exit", path.dep = TRUE, label = "sell")
add.distribution(strategy_st,
                 paramset.label = "MA",
                 component.type = "indicator",
                 component.label = "fastMA",
                 variable = list(n = 5 * 1:10),
                 label = "nFAST")
add.distribution(strategy_st, paramset.label = "MA",
                 component.type = "indicator", component.label = "slowMA",
                 variable = list(n = 5 * 1:10), label = "nSLOW")
add.distribution.constraint(strategy_st,
                            paramset.label = "MA",
                            distribution.label.1 = "nFAST",
                            distribution.label.2 = "nSLOW",
                            operator = "<",
                            label = "MA.Constraint")
After all this code, we have a strategy that lives in the .strategy environment, locked away from us. What if we were to create strategies like we create plots in ggplot2? The code might look like this:
myStrat <- strategy() +
               indicator(SMA, args = list(x = Close, n = 20),
                         label = "fastMA") +
               indicator(SMA, args = list(x = Close, n = 50),
                         label = "slowMA") +
               signal(sigCrossover, quote(fastMA > slowMA), label = "bull") +
               signal(sigCrossover, quote(fastMA < slowMA), label = "bear") +
               rule( ..... ) +
               rule( ..... ) +
               distribution( ...... ) +
               distribution( ...... ) +
               distribution_constraint( ...... )
In blotter (and thus quantstrat) we create porfolios and accounts like so:
portfolio_st <- "myPortf"
account_st <- "myAcct"

rm.strat(portfolio_st)
rm.strat(account_st)
# This creates a portfolio
initPortf(portfolio_st, symbols = symbols,
          initDate = initDate, currency = "USD")
# Then an account
initAcct(account_st, portfolios = portfolio_st,
         initDate = initDate, currency = "USD",
         initEq = 100000)
# And finally an orderbook
initOrders(portfolio_st, store = TRUE)
Then we run the strategy with:
applyStrategy(strategy_st, portfolios = portfolio_st)
and we see the results with this code:
updatePortf(portfolio_st)
dateRange <- time(getPortfolio(portfolio_st)$summary)[-1]
updateAcct(account_st, dateRange)
updateEndEq(account_st)
tStats <- tradeStats(Portfolios = portfolio_st, use="trades",
                     inclZeroDays = FALSE)
tStats[, 4:ncol(tStats)] <- round(tStats[, 4:ncol(tStats)], 2)
print(data.frame(t(tStats[, -c(1,2)])))

final_acct <- getAccount(account_st)
plot(final_acct$summary$End.Eq["2010/2016"] / 100000,
     main = "Portfolio Equity", ylim = c(0.8, 2.5))
lines(SPY$SPY.Adjusted / SPY$SPY.Adjusted[[1]], col = "blue")
A tidyverse approach might look like the following:
# Create an account with a pipe
myAcct <- symbols %>%
            portfolio(currency = "USD") %>%
            account(currency = "USD", initEq = 100000)

# Backtesting generates an object containing the orderbook and all other
# necessary data (such as price at trade)
ob <- myAcct %>% myStrat  # This is a backtest
Other functions would then extract any information we need from the object ob, when we ask for them.
If I wanted to optimize, I might do the following:
ob_list <- myAcct %>% myStrat(optim = "MA")  # Gives a list of orderbooks, and
                                             # optimizes the parameter set MA
And as for the original reason I started to gripe, I might be able to find slices for the analysis with caret functions (they exist), subset the data in symbols according to these slices, and get ob in, say, an lapply() loop.
I like the idea for this interface, myself.
Conclusion (On To Python)
I do not have the time to write a package like this myself. I don’t know enough and I am a Ph.D. student and should be preparing for qualifying exams/research/etc.. For now, though, I’m turned off to quantstrat, and thus R for backtesting and trading.
That said, my stock data analysis posts are still, by far, the most popular content of this blog, and I still would like to find a good backtesting system. I’m looking at going back to Python, and the backtrader package has caught my eye. I will either use that or zipline, but I am leaning to backtrader, since initially I like its logging features and its use of OOP.
I would love to hear thoughts and comments, especially from users of either backtrader or zipline or Python for stock data analysis in general.

I gave up on quantstrat 5 years ago when I was still in uni. Never liked its architecture and could never tell what is going to work and what is not. Also, R code of it is packed into long functions/methods. At a time I even wrote my own 500 lines of code backtester, which at the time was tens of times faster than quantstrat, but the gave up because realised the above:
Proper object oriented approach helps building a flexible and extendible framework. And I agree with you – python is your friend. Would recommend QStrader. I have not looked at it properly yet, but its event driven approach will bring you closer to real trading (at expense of speed of course). Zipline (better developed and more functional), although quite mature framework, but its architecture is a bit too messy for what it provides. In my opinion, its because it was developped to suit the needs of quantopian rather than provide “fork and go” easy to use and modify package. Having said that, I know few guys who are using it successfully and not complaining. 🙂
LikeLiked by 1 person
once again I really liked reading your blog post on trading in R. I really hope you do not only stick to python as I am working only in R. That said I hope, you really try again programming trading models with tidyquant/tidyverse (“Let’s try re-imagining what a better R backtesting package might look like, one that takes lessons from the tidyverse.”)
LikeLiked by 1 person
I would like to revisit it at some point. I think that if I wrote a package that does what I described in the post, it could be really popular and it would be my way of leaving my mark on the R universe, perhaps leading to jobs, talks, seminars and book deals. That opportunity really appeals to me. (If someone else writes it, I’d at least hope they’d mention me in credits.) And there are things that R does really well, even quantstrat; I was impressed by the use of quote() and functions that in principle anyone could write and substitute in, and I think R would handle that kind of functionality better than Python. But it would be a project pushing my limits, I doubt I know enough right now to write the best package, I’m already overburdened with other obligations, and perhaps by seeing how things are done in Python I will have better ideas of what a tidyverse version of a backtesting package would do.
LikeLike
Nice post Curtis. You’re definitely onto something. These packages are a big commitment. Python may have some advantages in OO, but R has advantages in infrastructure and time series handling that you might not be considering in the switch. At any rate, I like your idea and would like to see where you’d take it.
LikeLiked by 1 person
The loss of the time series functionality is not lost on me. I have no idea how that would be replaced in Python besides writing it up from scratch, or using rpy2 to use the R stuff. I would not be too surprised if I end up coming back to R.
One way or another I was going to explore the Python backtesting universe anyway, since I think there’s a lot of demand for that content. I’ve been planning to look at it for a while now.
LikeLike
Let us know how you make out with Python. I’m a bit biased, but I agree that exploration will only help.
Btw, the big advantage to tidyquant is scaleability. Not that you can’t scale from 1 to 500+ stocks in quantmod/xts, tq just makes things a bit easier. In R there’s always at least six ways to do something. As you show with quantstrat, sometimes it can be overly cumbersome. tq aims to make the motion from import (tq_get), to transform (tq_transmute), to aggregate (tq_portfolio), to analyze/model (tq_performance) as simple and modular as possible.
For your post, I dont think tidyquant will offer as much benefit since you are analyzing a single stock. With that said, tq is under major development. Let’s see where it goes 😉
LikeLiked by 1 person
To make backtesting framework fast you need to drop cumbersom objects like xts at all – they are very slow. Single item indexing is slow, while vectorized stuff is a bit faster. R is a statistical toolkit not a development language. Only recently I started seeing posts about test driven development in R – how can you build a software in an interpreted language without tests without leaving a trail of bugs? I am a fan of R myself – been using it for many years now, but use the right tool for the right thing. E.g. I use it as a source repository for algorithms I cant find anywhere else and sometimes call them from python. Its main purpose is data analysis and statistics. And I understand the temptation to build everything in R, but dont be religious and/or lazy – try other languages and compare.
LikeLike
I’m very interested in specific examples of what makes xts objects cumbersome and slow, because the entire point of the package is to make handling time-series data fast and easy.
You can certainly write simple backtesters using a matrix (which will sometimes be faster than xts). And you can write *really* fast backtests if you assume that all operations are *not* path dependent. But almost all of the backtests the developers of quantstrat are concerned with involve order management, which is path-dependent by definition. You need to know where your orders are.
LikeLiked by 1 person
I have not had any complaints with xts. It seems to make working with data pretty easy. That said I’ve never been worrying about performance.
LikeLike
Ok, lets make it clear. I am not saying that xts is very inefficient. I am sure people who wrote it did their best to make it efficient. Can it be more efficient? Probably, not sure. It is the same as python pandas library. Both are derivatives of base data types to provide new functionality and convenience methods. Convenience is an inverse function of speed. Whatever you do, xts will always be slower than simple vector.
I am not suggesting that replacement for xts should be developed. What I am saying that for an efficient backtesting system (brobably non event-driven) I would use simple vector. xts is one fits all at the expense of speed. Writing your custom stuff will make things faster as you will not be calling and checking the stuff that fits others but not you.
These times might be small. However, in case you are leveraging on optimization and parameter mining rather than complexity of your algorithms this will make enormous difference. I have tested this approach myself quite a while ago and for simple moving average strategies this was running dozens of times faster than quantstrat.
And yeah, for non-vectorized indexing xts is terrible. I know that for vectorized stuff it works well. Also, its binary (?) search is reasonably fast too so it is a good tool to index on dates if you can not avoid it or simply doing some data analysis.
But as I said, to make your backtester more efficient you simply don’t index on dates…
require(quantmod)
xts_object = getSymbols(“YHOO”,src=”google”, auto.assign=FALSE)
mat = coredata(xts_object)
vec = mat[,1]
> system.time(replicate(10000, {xts_object[1, 1]}))
user system elapsed
0.297 0.002 0.311
> system.time(replicate(10000, {mat[1, 1]}))
user system elapsed
0.015 0.000 0.015
> system.time(replicate(10000, {vec[1]}))
user system elapsed
0.006 0.000 0.007
LikeLike
In your last comment, you say, “Ok, lets make it clear. I am not saying that xts is very inefficient.” and then “for non-vectorized indexing xts is terrible.” I don’t consider “not very inefficient” and “terrible” as synonymous.
I recall having this same discussion with you privately via email about 3 years ago. In that conversation, I explained why xts is slower than matrix for this one specific case (i.e. x[1,1]): because the matrix subsetting C code has an optimization for it. In all other subsetting operations, xts is either similar or faster than matrix:
This file contains bidirectional Unicode text that may be interpreted or compiled differently than what appears below. To review, open the file in an editor that reveals hidden Unicode characters.
Learn more about bidirectional Unicode characters
subset_showdown_xts_matrix.R
hosted with ❤ by GitHub
Perhaps you don’t recall our email exchange. But I wanted to point out that your comment essentially cherry-picked the only subsetting operation I can find where xts is noticeably slower than matrix. And the “terrible” performance is still something that only takes a handful of microseconds for a large object on my laptop… so it’s difficult to make a case that it’s a practical performance issue.
While you did get >10x performance improvement from your code by switching from xts to matrix, you also lost all safety that your market data are ordered correctly. That’s not a trade-off I would make.
LikeLiked by 1 person
Nobody denies that quantstrat has a learning curve, as do other packages in the ReturnAnalytics family (I.E. PerformanceAnalytics, PortfolioAnalytics, etc.)
HOWEVER:
Note well that they are not packages deliberately made for retail consumption. They are packages created for industrial-level research, and are written by very high-level/senior quants and portfolio managers, and process backtests on swathes of tick data for trading analysis, or thousands of assets with complicated objective functions for portfolio management.
These tools have complexity because real-world trading gets very complex, and their features are necessary to model those dynamics.
I would recommend making liberal use of the R-SIG Finance mailing list for any inquiries you may have as to mechanics, as it may improve development in these packages, rather than giving up and moving onto more simplistic tools.
I’m not sure who wrote QSTrader in Python (if it’s Rob Carver, then it’s a safe bet to use), but zipline is behind quantstrat by a fair margin.
LikeLiked by 2 people
Thanks for sharing this, Ilya.
I’ve signed up to the mailing list. Thanks for the tip.
LikeLike
I’m not sure who wrote QSTrader in Python (if it’s Rob Carver, then it’s a safe bet to use)
Not me. Was Mike Halls Moore, now at AHL:
https://github.com/mhallsmoore/qstrader
LikeLike
Take a look at my blotter/R6 experiments in the sandbox/ directory of the blotter GitHub repo: https://github.com/braverock/blotter/blob/master/sandbox/blotter_R6.R
LikeLiked by 1 person
I tried running the code in this file on my system, but I got errors for the Account and Portfolio objects:
Error in R6Class(classname = “Account”, public = list(portfolios = NULL, :
All elements of public, private, and active must be named.
(Same for “Portfolio”)
I did read through the code and I like the idea. I like having portfolios and accounts be objects instead of locked away in an environment, and interacting with them using methods. (The Python packages I was looking at seem to use that approach, at least for strategies; backtrader I think treats strategies as objects with methods that you can customize. It is intuitive.)
I didn’t know about R6 until I saw this and I read through a demo of what it does, and I think it’s a good idea. Even if others don’t like that approach and want to use, say, magrittr pipes %>%, I don’t think it would be too difficult to write functions that serve as a “tidyverse interface” for the objects and thus allow that dialect to be used, if someone wanted. (Not that there’s anything wrong with method chaining, which I would like to see supported where appropriate.)
I thought about how that approach would solve the problem I set out initially to do with this post: the type of walk-forward analysis I wanted. I think it would be a lot easier using the method you’re suggesting: I could create a collection of these objects, backtest as I want in a loop, like lapply or something, and then collect the stats I want for each.
Basically, I think this approach is more flexible and more easily allows other tools to be combined with blotter’s objects, and I’m assuming that quantstrat strategies would also start to take a similar approach.
LikeLike
Sorry it didn’t run. I should have noted that it’s 3+ years old and I haven’t run it since then. I mainly wanted to point you to the API and notes.
You should be able to use pipes with that design, since functions would
generally return the object invisibly. While I generally prefer a pure
functional design, I’m not sure it’s the best choice here. I don’t think a
pure functional approach would be terrible for a strategy class, but it might
be cumbersome for a portfolio class inside a strategy…
LikeLike
I dont see a problem with you writing your own. Thats the point of programming. If something doesn’t work for you, fix it. Give back to the community that allows you to receive a degree and an income. R and python are best used together.
LikeLike
I’m reading this post as a newcomer to quantstrat having exactly the same problem you described here, but just over two years after your posted this. So I’m interested in where you ended up. Did Josh Ulrich convince you stick with it? Did Matt Dancho convince you to go whole-hog with tidyquant? Or are you running your customized python version of a backtester? How about an update? 🙂
LikeLiked by 1 person